
Tag: manhattan beach real estate
Happy Thanksgiving To Our Friends in Manhattan Beach
From all of us at Real Estate in Manhattan Beach.com, Keith Kyle Homes and Vista Sotheby’s International Realty, we wanted to wish you and yours a very happy Thanksgiving. Bring on the holidays!

September Real Estate Recap for Manhattan Beach
Take a look at our overview of the month that was for real estate in Manhattan Beach CA during the month of September 2021. While it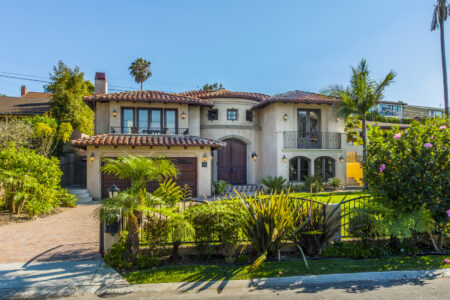 was a bit of a down month for the number of homes that closed escrow, it was a very impressive month in terms of home prices. There were 43 homes that sold during the month which was lower than the 61 that closed in September 2020 but median sales price was WAY do primarily to several oceanfront homes selling on the Manhattan Beach Strand during the month. The median sales price was $3,954,000 which was dramatically higher than the already impressive $3,058,000 from a year earlier. See how this compares with other months on our Manhattan Beach real estate trends page.
Search the current Manhattan Beach homes for sale
Manhattan Beach real estate at a glance

Home Sales and Property Prices in Manhattan Beach for July 2021
Welcome to the real estate recap for the month that was in July for home sales in Manhattan Beach. It was another amazing month for the Manhattan Beach real estate market as demand just never seems to slow. There were 45 total on market sales that closed with 14 homes in the sand section, 8 homes in tree section, 7 home sales in the hill section, 1 in Manhattan Village and the rest were east of Sepulveda. See how this compares with other months on our Manhattan Beach real estate trends page.
July 2021 Home Sales and Home Prices in Manhattan Beach
| Type | Address | Price | $ Per foot | Bed/Bath | Sq feet | Year | Date sold | |
| TWNHS/A | 304 | 3rd ST | $5,500,000 | $2,123.55 | 4/ | 2590/A | 2017/ASR | 7/1/2021 |
| SFR/D | 587 | 36th ST | $3,212,000 | $1,590.10 | 3/2,0,1,0 | 2020/A | 1984/ASR | 7/1/2021 |
| SFR/D | 659 | 18th ST | $4,250,000 | $1,052.76 | 4/3,0,0,0 | 4037/A | 1952/ASR | 7/1/2021 |
| SFR/D | 406 | Anderson ST | $4,950,000 | $1,150.09 | 5/4,0,0,0 | 4304/A | 2008/ASR | 7/1/2021 |
| SFR/D | 1120 | 5th ST | $1,800,000 | $595.43 | 4/3,0,0,0 | 3023/A | 1982/PUB | 7/1/2021 |
| SFR/D | 220 | 8th ST | $9,200,000 | $2,193.09 | 4/3,0,1,0 | 4195/A | 2017/SLR | 7/2/2021 |
| SFR/A | 24 | Westport | $3,100,000 | $952.09 | 4/2,1,1,0 | 3256/A | 1983/ASR | 7/2/2021 |
| SFR/D | 1015 N | Redondo AVE | $1,379,000 | $1,109.41 | 2/1,0,1,0 | 1243/A | 1951/ASR | 7/2/2021 |
| DPLX/D | 4305 | Crest DR | $2,125,000 | $1,135.15 | 4/2,0,1,0 | 1872/A | 1972/ASR | 7/7/2021 |
| SFR/D | 400 | Highland AVE | $3,175,000 | $1,784.71 | 3/2,0,0,0 | 1779/A | 1962/ASR | 7/7/2021 |
| SFR/D | 341 | 6th ST | $3,575,000 | $2,564.56 | 3/2,0,0,0 | 1394/A | 1948/ASR | 7/7/2021 |
| SFR/D | 3521 | Laurel AVE | $3,550,000 | $1,060.65 | 5/3,1,1,0 | 3347/A | 2014/ASR | 7/7/2021 |
| SFR/D | 2617 | Oak AVE | $1,790,000 | $1,598.21 | 3/1,0,0,0 | 1120/A | 1953/ASR | 7/8/2021 |
| SFR/D | 733 | 12th ST | $4,500,000 | $1,026.69 | 5/6,0,0,0 | 4383/S | 2017/ASR | 7/8/2021 |
| SFR/D | 1904 | Palm AVE | $4,600,000 | $1,220.81 | 5/5,0,0,0 | 3768/A | 2018/BLD | 7/8/2021 |
| SFR/D | 533 | 5th ST | $1,875,000 | $2,697.84 | 2/1,0,0,0 | 695/A | 1931/PUB | 7/9/2021 |
| SFR/D | 1307 | Voorhees AVE | $3,750,000 | $1,030.79 | 5/4,0,1,0 | 3638/A | 2019/PUB | 7/9/2021 |
| SFR/D | 1544 | Voorhees AVE | $3,995,000 | $768.27 | 6/5,0,1,0 | 5200/E | 2008/ASR | 7/9/2021 |
| SFR/D | 1704 | Highland AVE | $4,000,000 | $1,209.19 | 4/4,0,0,0 | 3308/P | 2001/PUB | 7/12/2021 |
| SFR/D | 461 | 28th ST | $2,400,000 | $1,963.99 | 3/2,0,0,0 | 1222/A | 1954/OTH | 7/14/2021 |
| SFR/D | 408 | 29th ST | $4,725,000 | $1,688.10 | 4/4,0,0,1 | 2799/P | 2021/PUB | 7/14/2021 |
| SFR/D | 1130 | 21st ST | $2,900,000 | $966.67 | 5/4,0,1,0 | 3000/B | 2021/SLR | 7/15/2021 |
| SFR/D | 587 | 26th ST | $3,850,000 | $1,108.55 | 4/3,0,0,0 | 3473/A | 2000/ASR | 7/16/2021 |
| SFR/D | 877 | 8th ST | $5,250,000 | $1,127.09 | 6/4,1,1,0 | 4658/A | 2006/ASR | 7/19/2021 |
| SFR/D | 421 | 32nd PL | $1,550,000 | $2,129.12 | 2/1,0,0,0 | 728/P | 1928/PUB | 7/20/2021 |
| SFR/D | 549 | 3rd ST | $4,799,000 | $1,199.75 | 5/5,0,1,0 | 4000/SEE | 2013/APP | 7/21/2021 |
| SFR/D | 501 N | Poinsettia AVE | $5,008,000 | $3,608.07 | 3/1,2,0,0 | 1388/A | 1941/ASR | 7/21/2021 |
| TWNHS/A | 320 | 33rd PL | $2,480,000 | $1,326.20 | 3/3,0,1,0 | 1870/A | 2007/ASR | 7/22/2021 |
| SFR/D | 1257 | 11th ST | $1,970,000 | $658.20 | 4/3,0,0,0 | 2993/A | 1960/ASR | 7/23/2021 |
| SFR/D | 1647 | Curtis AVE | $3,025,000 | $896.30 | 4/4,0,0,0 | 3375/T | 1996/ASR | 7/23/2021 |
| SFR/D | 2615 | Crest DR | $5,900,000 | $1,834.58 | 3/4,0,1,0 | 3216/A | 2016/ASR | 7/26/2021 |
| SFR/D | 1204 | Faymont AVE | $1,510,000 | $1,628.91 | 2/1,0,0,0 | 927/A | 1950/ASR | 7/26/2021 |
| SFR/D | 3201 | Maple AVE | $3,350,000 | $3,172.35 | 2/1,0,0,0 | 1056/A | 1950/ASR | 7/27/2021 |
| SFR/D | 706 | Anderson ST | $2,438,000 | $1,283.16 | 3/2,0,0,0 | 1900/A | 1969/APP | 7/27/2021 |
| SFR/D | 933 | 9th ST | $5,300,000 | $1,337.37 | 4/2,2,0,0 | 3963/B | 1986/ASR | 7/27/2021 |
| SFR/D | 1400 | Manzanita Lane | $3,515,000 | $976.93 | 5/2,2,1,0 | 3598/B | 2021/BLD | 7/27/2021 |
| SFR/D | 818 | 8th ST | $12,738,290 | $1,992.54 | 5/6,0,0,0 | 6393/A | 2000/PUB | 7/28/2021 |
| SFR/D | 1751 | 9th ST | $2,600,000 | $1,183.43 | 3/3,0,0,0 | 2197/A | 1986/ASR | 7/28/2021 |
| SFR | 1705 N | Meadows AVE | $1,600,000 | $1,596.81 | 3/1,0,0,0 | 1002/A | 1947/ASR | 7/29/2021 |
| SFR/D | 1610 | 21st ST | $1,650,000 | $1,260.50 | 3/2,0,0,0 | 1309/A | 1952/PUB | 7/29/2021 |
| TWNHS/A | 1845 | 11th ST | $1,430,000 | $1,000.00 | 2/2,0,0,0 | 1430/B | 2021/ASR | 7/29/2021 |
| SFR/D | 1618 | 6th ST | $3,279,415 | $809.73 | 5/5,0,0,0 | 4050/S | 1998/ASR | 7/29/2021 |
| SFR/D | 1622 | 5th ST | $3,525,000 | $839.29 | 4/3,0,1,0 | 4200/A | 1991/ASR | 7/29/2021 |
| DPLX/A | 219 | 27th ST | $4,000,000 | $1,388.89 | 5/3,0,1,0 | 2880/A | 1972/ASR | 7/30/2021 |
| SFR/D | 935 | Boundary PL | $2,080,000 | $1,047.33 | 4/3,0,0,0 | 1986/E | 1956/PUB | 7/30/2021 |
April Home Sales in Manhattan Beach – Real Estate Recap
Although April was certainly a slower month for real estate in Manhattan Beach, it was still a good month given the circumstances and uncertainties. There were 23 closed home sales during April 2020 with a median list price was $2,999,000. The median sales price of $2,900,000 indicates a continuing strong buyer demand. The average price per foot was
$1338.80 and the average days on market was 67 (median days on market was a very short 12).
View the current homes for sale in Manhattan Beach
April 2020 Home Sales and Prices in Manhattan Beach CA
|
Type
|
Address |
Price
|
$ Per Foot
|
Bed/Bath
|
Sq Feet
|
Year Built
|
|
|
SFR/D
|
309
|
Gull ST |
$1,650,000
|
$1,465.36
|
2/2,0,0,0
|
1126/A
|
1958/ASR
|
|
SFR/D
|
310
|
36th |
$1,780,000
|
$1,751.97
|
2/1,0,0,0
|
1016/A
|
1930/ASR
|
|
SFR/D
|
410
|
31st ST |
$2,215,000
|
$1,393.08
|
3/2,0,0,0
|
1590/A
|
1969/ASR
|
|
SFR/D
|
436
|
1st ST |
$2,599,000
|
$1,359.31
|
4/2,0,0,0
|
1912/A
|
1955/ASR
|
|
TWNHS/D
|
3317
|
Vista DR |
$2,600,000
|
$1,061.22
|
4/4,0,1,0
|
2450/S
|
2004/ASR
|
|
TWNHS/A
|
432
|
23rd ST |
$2,650,000
|
$1,325.00
|
3/3,0,1,0
|
2000/SEE
|
2014/SLR
|
|
TWNHS/A
|
222
|
1st PL |
$2,760,000
|
$1,374.50
|
3/3,0,1,0
|
2008/A
|
2019/ASR
|
|
TWNHS/A
|
217
|
21St. PL |
$3,815,000
|
$1,942.46
|
3/3,0,1,0
|
1964/B
|
2019/BLD
|
|
SFR/A
|
225
|
25th ST |
$4,150,000
|
$1,619.20
|
5/4,0,0,0
|
2563/A
|
1967/ASR
|
|
SFR/A
|
333
|
18th ST |
$4,575,000
|
$1,171.88
|
6/6,0,1,0
|
3904/A
|
2004/ASR
|
|
DPLX/D
|
120
|
6th ST |
$5,253,772
|
$2,842.95
|
4/3,0,0,0
|
1848/A
|
1955/ASR
|
|
SFR/D
|
124
|
6th ST |
$6,589,478
|
$1,641.62
|
5/6,0,0,0
|
4014/A
|
1990/ASR
|
|
SFR/D
|
202
|
Ocean DR |
$11,000,000
|
$2,647.41
|
5/5,0,1,0
|
4155/A
|
2006/ASR
|
|
SFR/D
|
3405
|
Walnut AV |
$3,000,000
|
$822.59
|
4/3,0,1,0
|
3647/A
|
1987/ASR
|
|
SFR/D
|
756
|
36th ST |
$3,525,000
|
$979.44
|
6/3,3,1,0
|
3599/B
|
2016/PUB
|
|
SFR/D
|
844
|
14th ST |
$3,730,000
|
$1,072.15
|
5/2,3,1,0
|
3479/B
|
2020/BLD
|
|
SFR/D
|
501 N
|
18th ST |
$6,750,000
|
$1,101.86
|
5/2,4,2,0
|
6126/B
|
2019/SLR
|
|
SFR/D
|
939
|
Duncan AV |
$3,500,000
|
$886.75
|
4/4,0,0,0
|
3947/A
|
1990/ASR
|
|
TWNHS/A
|
14
|
Bermuda |
$1,160,000
|
$745.02
|
2/1,1,1,0
|
1557/A
|
1987/PUB
|
|
TWNHS/A
|
1320
|
12th ST # |
$770,000
|
$612.57
|
2/2,0,0,0
|
1257/A
|
1974/ASR
|
|
SFR/D
|
1612
|
9th ST |
$2,100,000
|
$1,191.83
|
3/1,1,0,0
|
1762/A
|
1965/ASR
|
|
SFR/D
|
1632
|
11th ST |
$2,355,000
|
$1,069.48
|
3/2,0,0,0
|
2202/A
|
1996/SLR
|
|
SFR/D
|
1843
|
6th ST |
$2,900,000
|
$714.81
|
5/4,0,1,0
|
4057/A
|
1998/ASR
|
Manhattan Beach Market Information for April
|
April 2020 was a Neutral market* Home For Sale in April 2020: 88 units.
|
March 2020 Manhattan Beach Home Sales
While the impacts of the coronavirus concerns didn’t really impact home sales in March we’ll likely see a significant slowdown in the April home sale number. The numbers for March: The median list price for homes in Manhattan was $2,399,000 with the median sold price also at $2,399,000 indicating a very strong sellers market.
Average price per foot was $1152.43, average days on market was 60 but the median days on market was a very low 11. 8 of the homes were in the sand section, 6 were in the tree section, 2 in the hill section and the rest in east Manhattan and Manhattan Village.
The big sale of the month was an oceanfront lot sale at 2304 The Strand that sold for $7,400,000 View all of the current Manhattan Beach oceanfront Strand homes for sale.
View the current homes for sale in Manhattan Beach
March 2020 Home Sales and Home Prices| Type | Address | Price | $ Per Foot | Bed/Bath | Sq Feet | Year Built | Sold Date | |
| DPLX/A | 216 | 39th ST | $1,550,000 | $1,014.40 | 2/2,0,0,0 | 1528/A | 1931/ASR | 3/31/2020 |
| SFR/A | 116 | Seaview ST | $2,075,000 | $1,571.97 | 3/0,2,0,0 | 1320/A | 1959/ASR | 3/23/2020 |
| TWNHS/A | 2301 | Grandview AVE | $2,399,000 | $1,315.96 | 3/4,0,0,0 | 1823/A | 2000/PUB | 3/18/2020 |
| COMRES/A | 4108 | Highland AVE | $2,500,000 | $678.98 | 3/2,0,2,0 | 3682/A | 1990/ASR | 3/19/2020 |
| SFR/D | 441 | 1st ST | $3,245,265 | $694.03 | 5/4,0,0,0 | 4676/A | 2004/ASR | 3/25/2020 |
| TWNHS/A | 216 | Marine AVE | $3,750,000 | $1,922.09 | 3/3,0,1,0 | 1951/B | 2019/BLD | 3/12/2020 |
| TWNHS/A | 314 | 32nd ST | $3,850,000 | $1,163.14 | 3/2,0,1,0 | 3310/A | 2006/ASR | 3/3/2020 |
| SFR/D | 2304 | The Strand | $7,400,000 | $3,135.59 | 3/2,0,1,0 | 2360/A | 1965/ASR | 3/3/2020 |
| SFR | 908 | Rosecrans | $1,250,000 | $1,502.40 | 2/1,0,0,0 | 832/A | 1952 | 3/13/2020 |
| SFR/D | 2416 | Elm AVE | $1,995,000 | $971.28 | 4/2,1,0,0 | 2054/A | 1960/ASR | 3/3/2020 |
| SFR/D | 598 | 36th ST | $2,500,000 | $821.29 | 5/3,0,0,0 | 3044/A | 1987/ASR | 3/6/2020 |
| SFR/D | 591 | 26th ST | $3,200,000 | $879.12 | 5/3,1,1,0 | 3640/A | 2001/ASR | 3/18/2020 |
| SFR/D | 720 | 33rd ST | $3,625,000 | $906.25 | 5/3,0,1,0 | 4000/O | 2001/ASR | 3/6/2020 |
| SFR/D | 663 | 18th ST | $5,900,000 | $1,204.08 | 5/5,0,1,0 | 4900/O | 2004/ASR | 3/3/2020 |
| SFR/A | 822 | 6th ST | $3,575,000 | $1,879.60 | 3/1,1,1,0 | 1902/A | 1959/ASR | 3/3/2020 |
| SFR/D | 852 | 8th ST | $6,200,000 | $1,317.75 | 5/5,0,1,0 | 4705/A | 2008/ASR | 3/10/2020 |
| TWNHS/A | 13 | Lafayette CT | $1,450,000 | $756.78 | 3/2,0,1,0 | 1916/A | 1985/ASR | 3/1/2020 |
| TWNHS/A | 1401 | 12th ST #D | $925,000 | $678.15 | 3/2,0,0,0 | 1364/A | 1978/ASR | 3/31/2020 |
| SFR/D | 1500 | Lynngrove DR | $1,790,000 | $1,008.45 | 3/1,0,1,0 | 1775/A | 1950/ASR | 3/18/2020 |
| SFR/D | 2101 | Chestnut AVE | $1,860,000 | $1,066.51 | 3/2,0,0,0 | 1744/A | 1948/ASR | 3/23/2020 |
| SFR/D | 2112 | Magnolia AVE | $2,300,000 | $895.99 | 4/2,0,1,0 | 2567/A | 1974/SEE | 3/13/2020 |
| SFR/D | 1315 | 21st ST | $2,583,499 | $995.18 | 3/3,0,0,0 | 2596/A | 2008/ASR | 3/9/2020 |
| TWNHS/A | 1619 | Artesia BLVD #E | $1,360,000 | $623.85 | 3/2,0,1,0 | 2180/A | 2008/ASR | 3/30/2020 |
| SFR | 1756 | 11TH ST | $1,399,000 | $923.43 | 3/2,0,0,0 | 1515/AP | 1955 | 3/10/2020 |
| SFR/D | 707 S | Redondo Ave | $2,180,000 | $884.38 | 4/2,2,0,0 | 2465/S | 1944/ASR | 3/16/2020 |
Home Sales and Prices in Manhattan Beach for November
November 2019 was a busy month for real estate in Manhattan Beach CA with 42 total MLS home sales. That’s not an uncommon number of home sales but it’s fairly high for November. The median “for sale” price for the month was $2,799,000 with the actual median price of home sales at $2,500,000. That discrepancy is much larger than in previous months and is an indicator that the market may be slowing a bit and starting to favor buyers too a limted extent. The highest priced sale of the month was $8,525,000 for a land value sale at 3212 The Strand which was a beachfront home originally priced at $8,999,000. The lowest priced sale of the month was $1,220,000 for a 2012 built townhome on Matthews in East Manhattan.
See the current homes and properties for sale in Manhattan Beach CA
November 2019 Home Sales in Manhattan Beach
| MLS | Type | Address | Price | $ per Foot | Bed/Bath | Sq Feet | Year | Sold Date | |
| SB19143125 | TWNHS/A | 3505 | Crest DR #B | $1,700,000 | $952 | 3/2,0,1,0 | 1785/A | 1985/ASR | 11/25/2019 |
| SB19225682 | SFR/D | 225 | 39th ST | $1,900,000 | $1,193 | 3/0,3,0,0 | 1592/A | 1960/ASR | 11/27/2019 |
| SB19189797 | SFR/D | 1209 | Bayview DR | $2,075,000 | $1,516 | 2/1,1,0,0 | 1369/A | 2001/ASR | 11/1/2019 |
| SB19163986 | SFR/D | 3201 | Alma AVE | $2,225,000 | $2,289 | 2/2,0,0,0 | 972/A | 1930/ASR | 11/6/2019 |
| SB19198538 | SFR/D | 228 | 33rd ST | $2,500,000 | $1,524 | 3/1,1,1,0 | 1640/T | 1999/ASR | 11/22/2019 |
| SB19237277 | TWNHS/D | 3108 | Alma AVE | $2,625,000 | $1,137 | 3/3,0,1,0 | 2309/A | 2003/ASR | 11/22/2019 |
| SB19209982 | SFR/D | 513 | 5th ST | $2,800,000 | $2,811 | 3/1,0,0,0 | 996/A | 1941/ASR | 11/15/2019 |
| SB19222605 | TWNHS/A | 218 | 1st PL | $3,090,000 | $1,533 | 3/4,0,0,0 | 2016/A | 2019/ASR | 11/22/2019 |
| SB19180290 | SFR/D | 316 | 20th ST | $3,120,000 | $1,332 | 4/3,0,0,0 | 2342/A | 1956/ASR | 11/20/2019 |
| SB19213070 | TWNHS/A | 220 | 9th ST | $3,300,000 | $1,714 | 3/3,0,1,0 | 1925/OTH | 1999/ASR | 11/21/2019 |
| SB19223031 | SFR/D | 524 | 24th ST | $3,325,000 | $950 | 6/2,3,0,0 | 3500/A | 2008/ASR | 11/25/2019 |
| SB19151992 | SFR/D | 424 | 1st ST | $4,100,000 | $931 | 5/4,0,1,0 | 4404/AP | 2019/BLD | 11/26/2019 |
| SB19211056 | SFR/D | 301 | 20th ST | $4,900,000 | $1,659 | 4/5,0,1,0 | 2954/B | 2018/BLD | 11/6/2019 |
| SB19256008 | SFR/D | 425 | 10th ST | $5,850,000 | $1,393 | 5/4,0,1,0 | 4200/E | 2019/PUB | 11/1/2019 |
| SB19138789 | SFR/D | 3212 | The Strand | $8,525,000 | $3,695 | 3/1,3,0,0 | 2307/A | 1940/ASR | 11/15/2019 |
| SB19216606 | SFR/D | 613 | 19th ST | $1,850,000 | $1,487 | 3/2,0,0,0 | 1244/A | 1951/ASR | 11/18/2019 |
| SB19209607 | SFR/D | 1820 | Oak AVE | $1,933,000 | $520 | 4/3,0,1,0 | 3720/A | 1990/ASR | 11/4/2019 |
| SB19218303 | SFR/D | 559 | 33rd ST | $2,080,000 | $1,189 | 4/2,0,0,0 | 1750/A | 1948/APP | 11/17/2019 |
| SB19206264 | SFR/D | 2501 | Pine AVE | $2,325,000 | $727 | 5/4,0,0,0 | 3200/SEE | 1997/ASR | 11/5/2019 |
| SB19069902 | SFR/D | 931 | 17th ST | $2,700,000 | $702 | 6/4,0,1,0 | 3846/A | 2004/ASR | 11/15/2019 |
| SB19259547 | SFR/D | 2306 | John ST | $3,199,000 | $892 | 5/4,0,0,0 | 3585/A | 1999/ASR | 11/27/2019 |
| SB19208383 | SFR/D | 2400 | John ST | $4,210,000 | $1,193 | 5/2,3,1,0 | 3529/B | 2019/SLR | 11/8/2019 |
| SB19171932 | SFR/D | 608 | 15th ST | $4,500,000 | $891 | 5/4,0,2,0 | 5050/A | 2007/APP | 11/8/2019 |
| SB19169652 | SFR/D | 653 | 27th ST | $4,850,000 | $1,017 | 5/5,0,1,0 | 4767/D | 2019/BLD | 11/21/2019 |
| SB19216945 | SFR/D | 555 | 35th ST | $4,975,000 | $1,185 | 4/1,3,2,0 | 4200/B | 2017/BLD | 11/8/2019 |
| SB19231054 | SFR/D | 559 | 31st ST | $5,200,000 | $1,044 | 6/6,0,2,0 | 4982/B | 2019/BLD | 11/26/2019 |
| SB19198609 | SFR/D | 712 | Anderson ST | $1,800,000 | $894 | 3/2,0,1,0 | 2014/A | 1969/ASR | 11/15/2019 |
| SB19259252 | SFR/D | 508 | Larsson ST | $3,275,000 | $700 | 5/6,0,0,0 | 4680/S | 2010/ASR | 11/5/2019 |
| SB19118078 | SFR/D | 210 | Poinsettia AVE | $7,100,000 | $1,294 | 6/2,3,1,0 | 5486/D | 2019/BLD | 11/26/2019 |
| SB19222805 | TWNHS/A | 26 | Fairway DR | $1,950,000 | $813 | 4/2,0,1,0 | 2400/E | 1987/ASR | 11/6/2019 |
| 19509856 | SFR/D | 8 | CAMBRIDGE | $2,158,163 | $730 | 3/2,0,1,0 | 2955/A | 1982 | 11/26/2019 |
| SB19206276 | SFR/D | 1631 | 22nd ST | $1,300,000 | $1,295 | 3/1,0,0,0 | 1004/A | 1952/ASR | 11/6/2019 |
| SB19212452 | TWNHS/A | 1461 | 12th ST #B | $1,325,000 | $760 | 3/3,0,0,0 | 1743/A | 2003/ASR | 11/21/2019 |
| SB19229133 | SFR/D | 1131 | 21st ST | $1,340,000 | $694 | 3/2,0,0,0 | 1931/A | 1948/ASR | 11/7/2019 |
| SB19237109 | SFR/D | 1908 | Manzanita LN | $2,299,000 | $1,148 | 3/1,2,1,0 | 2002/D | 1950/ASR | 11/15/2019 |
| 19510770 | SFR/D | 1617 | CHESTNUT AVE | $2,475,000 | $570 | 5/4,0,1,0 | 4343/ | 2002 | 11/7/2019 |
| SB19261512 | SFR/D | 2113 | Chestnut AVE | $2,790,000 | $786 | 5/5,0,1,0 | 3549/P | 2016/PUB | 11/8/2019 |
| SB19238743 | TWNHS/A | 1773 | Mathews AVE | $1,220,000 | $678 | 3/2,0,1,0 | 1800/A | 2012/ASR | 11/13/2019 |
| PW19227742 | SFR/D | 1317 | Curtis AVE | $1,375,000 | $944 | 3/2,0,0,0 | 1457/A | 1951/ASR | 11/7/2019 |
| PV19136852 | SFR/D | 1757 | Ruhland AVE | $1,550,000 | $847 | 4/1,0,1,0 | 1831/A | 1959/ASR | 11/22/2019 |
| SB19177147 | SFR/D | 200 | Haley WAY | $2,125,000 | $630 | 5/4,0,0,0 | 3373/A | 1996/ASR | 11/15/2019 |
| AR19225526 | SFR/D | 1706 | Voorhees AVE | $2,465,000 | $575 | 4/4,0,0,0 | 4289/A | 1996/ASR | 11/18/2019 |
| SR19109564 | SFR/D | 1659 | 6th ST | $2,675,000 | $509 | 6/6,0,0,0 | 5255/A | 2002/ASR | 11/23/2019 |
Manhattan Beach Home Sales in June 2017
 Welcome to the June Manhattan Beach real estate market update. June 2017 was a big month for home sales in Manhattan Beach CA with a significant number of homes selling. The summer months are always an active market in the Beach Cities and this year was no different with 57 Manhattan Beach homes closing escrow. Thats well above the normal number of Manhattan homes selling in a month. Median home prices were up significantly over June of the previous year with the median home in Manhattan Beach selling at just under $2,467,000 which was a 28% increase from June of the prior year. According to Manhattan Beach realtor Keith Kyle, the market has been driven by a constant demand with inventory levels still remaining historically low. Click here to see all of the recent home sales in Manhattan Beach CA.
| City | Homes Sold | June 2017 Median | June 2016 Median | Year over Year % Change% |
| Carson | 61 | $445,000 | $450,000 | -1.1% |
| El Segundo | 15 | $800,000 | $1,135,000 | -29% |
| Gardena | 70 | $461,000 | $430,000 | 7.2% |
| Harbor City | 19 | $465,000 | $547,000 | -15% |
| Hawthorne | 45 | $592,000 | $624,000 | -5.1% |
| Hermosa Beach | 26 | $1,718,000 | $1,274,500 | 34.8 |
| Lawndale | 12 | $535,000 | $519,000 | 3.1% |
| Lomita | 18 | $565,000 | $555,000 | 1.8% |
| Long Beach | 419 | $523,000 | $470,000 | 11.2% |
| Manhattan Beach | 57 | $2,467,000 | $1,924,000 | 28.2% |
| Marina Del Rey | 34 | $968,000 | $900,000 | 7.6% |
| Palos Verdes Estates | 46 | $1,679,000 | $1,533,000 | 9.5% |
| Playa Del Rey | 34 | $683,000 | $603,000 | 13.3% |
| Rancho Palos Verdes | 75 | $1,240,000 | $1,200,000 | 3.3% |
| Redondo Beach | 117 | $969,000 | $945,000 | 2.5% |
| San Pedro | 82 | $510,000 | $500,000 | 1.9% |
| Torrance | 184 | $673,000 | $635,000 | 5.9% |
| Westchester | 42 | $1,090,000 | $1,050,000 | 3.8% |