Luxury homes for sale in Manhattan Beach

Manhattan Beach Real Estate Report – July 2023 Home Prices

Manhattan Beach Real Estate

See the 20 homes that sold in Manhattan Beach in July

Welcome to the Manhattan Beach real estate market report for July of 2023.

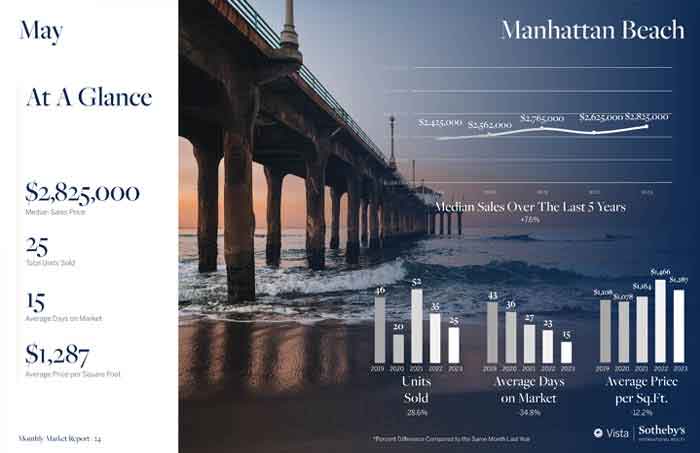
There were 20 closed escrows last month which was a drop from the 28 in the previous month.

The average “listing” price for the homes that sold was $3,142,545 with the average sold price at $3,081,300.

The average days on market was a very brief 26 and the sold homes averaged $1,472 per square foot.  

See how this compares to other months on our Manhattan Beach real estate trends and statistics page.
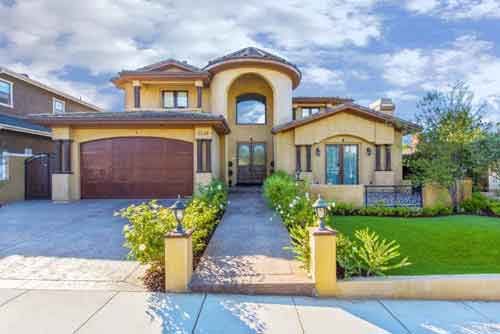
The top Manhattan Beach home sale of the month was $8,000,000 for an off market new construction home at 1002 10th Street, Manhattan Beach.

Luxury homes for sale

Manhattan Beach Home Sales and Prices in July

Type AddressPrice$ Per FootBed/BathSq FeetAge
TWNHS/A41215th PL$2,425,000$1,2963/3,0,1,01871/A2003/ASR
SFR/D3161st PL$2,530,000$1,1674/1,1,1,02168/A1964/ASR
SFR/D1328th ST$3,000,000$2,0413/3,0,0,01470/A1960/ASR
SFR/D52724th ST$3,075,000$1,4604/2,0,0,02106/A1963/ASR
SFR/D22923rd ST$3,500,000$1,7613/3,0,1,01987/A2002/BLD
SFR/D3108Elm AVE$1,700,000$2,0662/1,0,0,0823/A1948/ASR
SFR/D2500Pine Ave$1,911,000$1,4713/2,0,0,01299/A1950/ASR
SFR/D2809Oak AVE$4,300,000$1,3745/5,0,1,03130/B2023/BLD
SFR/D67719th ST$8,770,000$1,5686/7,0,0,05592/A2016/ASR
SFR/D93210th ST$2,715,000$1,2364/2,0,0,02196/A1948/PUB
SFR/D100210th ST$8,000,000$1,3175/5,0,1,06076/A2023/BLD
SFR/D1305Faymont AVE$1,425,000$1,6122/1,0,0,0884/A1950/ASR
SFR/D1151Magnolia AVE$1,615,000$1,2723/1,0,0,01270/A1948/ASR
SFR/D115023rd ST$1,780,000$1,8093/1,0,0,0984/A1948/ASR
SFR/D120823rd Street$1,900,000$8813/2,1,0,02157/A1948/ASR
SFR/D1500Faymont AVE$2,575,000$1,4033/2,0,1,01835/B1950/ASR
SFR/D143721st ST$3,630,000$1,0395/3,0,0,03495/A1989/ASR
SFR/D14675th ST$1,600,000$1,8893/1,0,0,0847/A1923/ASR
SFR/D1637Nelson AVE$1,825,000$1,7072/1,0,0,01069/A1952/ASR
SFR/D12209th Street$3,350,000$1,0864/3,0,0,03085/A1987/ASR

Any information relating to a property referenced on this web site comes from CRMLS. This web site may reference real estate listing(s) held by a brokerage firm other than the broker and/or agent who owns this website. The accuracy of all information is deemed reliable but not guaranteed and should be personally verified through personal inspection by and/or with the appropriate professionals.

Manhattan Beach real estate market

Manhattan Beach Real Estate Market Overview

August was a big month for home sales and home prices in the luxury community of Manhattan Beach.  47 homes and properties sold during the month which was impressive on it’s own.  Combined with a median sales price of $3,221,000 and that really made August a record month for the past few years.  View the homes that sold during August in Manhattan Beach.

View the current homes for sale in Manhattan Beach


March 2020 Manhattan Beach Home Sales

While the impacts of the coronavirus concerns didn’t really impact home sales in March we’ll likely see a significant slowdown in the April home sale number. The numbers for March:  The median list price for homes in Manhattan was $2,399,000 with the median sold price also at $2,399,000 indicating a very strong sellers market.  Average price per foot was $1152.43, average days on market was 60 but the median days on market was a very low 11.  8 of the homes were in the sand section, 6 were in the tree section, 2 in the hill section and the rest in east Manhattan and Manhattan Village. The big sale of the month was an oceanfront lot sale at 2304 The Strand that sold for $7,400,000  View all of the current Manhattan Beach oceanfront Strand homes for sale.

View the current homes for sale in Manhattan Beach

March 2020 Home Sales and Home Prices
Type   Address Price $ Per Foot Bed/Bath Sq Feet Year Built Sold Date
DPLX/A 216 39th ST   $1,550,000 $1,014.40 2/2,0,0,0 1528/A 1931/ASR 3/31/2020
SFR/A 116 Seaview ST   $2,075,000 $1,571.97 3/0,2,0,0 1320/A 1959/ASR 3/23/2020
TWNHS/A 2301 Grandview AVE   $2,399,000 $1,315.96 3/4,0,0,0 1823/A 2000/PUB 3/18/2020
COMRES/A 4108 Highland AVE   $2,500,000 $678.98 3/2,0,2,0 3682/A 1990/ASR 3/19/2020
SFR/D 441 1st ST   $3,245,265 $694.03 5/4,0,0,0 4676/A 2004/ASR 3/25/2020
TWNHS/A 216 Marine AVE   $3,750,000 $1,922.09 3/3,0,1,0 1951/B 2019/BLD 3/12/2020
TWNHS/A 314 32nd ST   $3,850,000 $1,163.14 3/2,0,1,0 3310/A 2006/ASR 3/3/2020
SFR/D 2304 The Strand    $7,400,000 $3,135.59 3/2,0,1,0 2360/A 1965/ASR 3/3/2020
SFR 908 Rosecrans   $1,250,000 $1,502.40 2/1,0,0,0 832/A 1952 3/13/2020
SFR/D 2416 Elm AVE   $1,995,000 $971.28 4/2,1,0,0 2054/A 1960/ASR 3/3/2020
SFR/D 598 36th ST   $2,500,000 $821.29 5/3,0,0,0 3044/A 1987/ASR 3/6/2020
SFR/D 591 26th ST   $3,200,000 $879.12 5/3,1,1,0 3640/A 2001/ASR 3/18/2020
SFR/D 720 33rd ST   $3,625,000 $906.25 5/3,0,1,0 4000/O 2001/ASR 3/6/2020
SFR/D 663 18th ST   $5,900,000 $1,204.08 5/5,0,1,0 4900/O 2004/ASR 3/3/2020
SFR/A 822 6th ST   $3,575,000 $1,879.60 3/1,1,1,0 1902/A 1959/ASR 3/3/2020
SFR/D 852 8th ST   $6,200,000 $1,317.75 5/5,0,1,0 4705/A 2008/ASR 3/10/2020
TWNHS/A 13 Lafayette CT   $1,450,000 $756.78 3/2,0,1,0 1916/A 1985/ASR 3/1/2020
TWNHS/A 1401 12th ST   #D $925,000 $678.15 3/2,0,0,0 1364/A 1978/ASR 3/31/2020
SFR/D 1500 Lynngrove DR   $1,790,000 $1,008.45 3/1,0,1,0 1775/A 1950/ASR 3/18/2020
SFR/D 2101 Chestnut AVE   $1,860,000 $1,066.51 3/2,0,0,0 1744/A 1948/ASR 3/23/2020
SFR/D 2112 Magnolia AVE   $2,300,000 $895.99 4/2,0,1,0 2567/A 1974/SEE 3/13/2020
SFR/D 1315 21st ST   $2,583,499 $995.18 3/3,0,0,0 2596/A 2008/ASR 3/9/2020
TWNHS/A 1619 Artesia BLVD   #E $1,360,000 $623.85 3/2,0,1,0 2180/A 2008/ASR 3/30/2020
SFR 1756 11TH ST   $1,399,000 $923.43 3/2,0,0,0 1515/AP 1955 3/10/2020
SFR/D 707 S Redondo Ave    $2,180,000 $884.38 4/2,2,0,0 2465/S 1944/ASR 3/16/2020