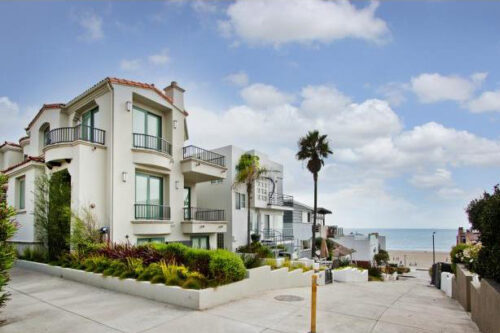
Walkstreet homes in Manhattan Beach

Home Sales and Home Prices in Manhattan Beach in October

Manhattan Beach October Real Estate Report

11 Manhattan Beach Home Sales in October 2023

Welcome to the Manhattan Beach real estate market update for October.

It was a fairly slow month in terms of the number of closed escrows with only 11 home sales in October. Compare that to the number of homes that sold in September at 28 and 35 in August.

The average “asking price” in October was $3,496,182 with the average sold price at $3,423,670 compared to $3,275,107 in September.

The average price per square foot was down from August and was $1430 in September. Homes averaged only 21 days on market before going into escrow.

See how this compares to other months on our Manhattan Beach real estate trends and statistics page.

Manhattan Beach Home Sales and Home Prices

Home Type Address Price $ Per Foot Bed/Bath Sq Feet Age
TWNHS/A 315 Gull St $3,100,000 $1,223 3/3,0,1,0 2535/O 2006/ASR
TWNHS/A 221 4th PL $3,100,000 $1,240 3/2,1,1,0 2500/B 2001/ASR
CONDO 4406 The Strand $4,623,373 $2,162 3/2,0,1,0 2138/ 1992
TWNHS/D 412 Manhattan Ave $5,600,000 $2,240 4/1,3,1,0 2500/B 2023/BLD
SFR/D 2508 Pacific AVE $1,810,000 $1,407 3/1,1,0,0 1286/A 1950/ASR
SFR/D 2416 Palm AVE $2,355,000 $839 5/2,1,0,0 2808/T 1961/ASR
SFR/D 2701 N Valley DR $2,462,000 $1,307 4/2,1,0,0 1883/A 1963/ASR
SFR/D 118 N Ardmore AVE $2,550,000 $1,510 2/2,0,0,0 1689/A 1952/ASR
SFR/D 868 9th ST $8,495,000 $1,537 5/2,3,1,0 5526/P 2021
TWNHS/A 34 Bermuda Ct. $1,890,000 $910 3/2,0,1,0 2077/A 1987/ASR
SFR/D 1612 Magnolia AVE $1,675,000 $1,355 4/1,1,0,0 1236/A 1947/ASR
Any information relating to a property referenced on this web site comes from CRMLS. This web site may reference real estate listing(s) held by a brokerage firm other than the broker and/or agent who owns this website. The accuracy of all information is deemed reliable but not guaranteed and should be personally verified through personal inspection by and/or with the appropriate professionals.
Luxury homes for sale in Manhattan Beach

Manhattan Beach Real Estate Report – July 2023 Home Prices

Manhattan Beach Real Estate

See the 20 homes that sold in Manhattan Beach in July

Welcome to the Manhattan Beach real estate market report for July of 2023.

There were 20 closed escrows last month which was a drop from the 28 in the previous month.

The average “listing” price for the homes that sold was $3,142,545 with the average sold price at $3,081,300.

The average days on market was a very brief 26 and the sold homes averaged $1,472 per square foot.  

See how this compares to other months on our Manhattan Beach real estate trends and statistics page.

The top Manhattan Beach home sale of the month was $8,000,000 for an off market new construction home at 1002 10th Street, Manhattan Beach.

Luxury homes for sale

Manhattan Beach Home Sales and Prices in July

Type AddressPrice$ Per FootBed/BathSq FeetAge
TWNHS/A41215th PL$2,425,000$1,2963/3,0,1,01871/A2003/ASR
SFR/D3161st PL$2,530,000$1,1674/1,1,1,02168/A1964/ASR
SFR/D1328th ST$3,000,000$2,0413/3,0,0,01470/A1960/ASR
SFR/D52724th ST$3,075,000$1,4604/2,0,0,02106/A1963/ASR
SFR/D22923rd ST$3,500,000$1,7613/3,0,1,01987/A2002/BLD
SFR/D3108Elm AVE$1,700,000$2,0662/1,0,0,0823/A1948/ASR
SFR/D2500Pine Ave$1,911,000$1,4713/2,0,0,01299/A1950/ASR
SFR/D2809Oak AVE$4,300,000$1,3745/5,0,1,03130/B2023/BLD
SFR/D67719th ST$8,770,000$1,5686/7,0,0,05592/A2016/ASR
SFR/D93210th ST$2,715,000$1,2364/2,0,0,02196/A1948/PUB
SFR/D100210th ST$8,000,000$1,3175/5,0,1,06076/A2023/BLD
SFR/D1305Faymont AVE$1,425,000$1,6122/1,0,0,0884/A1950/ASR
SFR/D1151Magnolia AVE$1,615,000$1,2723/1,0,0,01270/A1948/ASR
SFR/D115023rd ST$1,780,000$1,8093/1,0,0,0984/A1948/ASR
SFR/D120823rd Street$1,900,000$8813/2,1,0,02157/A1948/ASR
SFR/D1500Faymont AVE$2,575,000$1,4033/2,0,1,01835/B1950/ASR
SFR/D143721st ST$3,630,000$1,0395/3,0,0,03495/A1989/ASR
SFR/D14675th ST$1,600,000$1,8893/1,0,0,0847/A1923/ASR
SFR/D1637Nelson AVE$1,825,000$1,7072/1,0,0,01069/A1952/ASR
SFR/D12209th Street$3,350,000$1,0864/3,0,0,03085/A1987/ASR

Any information relating to a property referenced on this web site comes from CRMLS. This web site may reference real estate listing(s) held by a brokerage firm other than the broker and/or agent who owns this website. The accuracy of all information is deemed reliable but not guaranteed and should be personally verified through personal inspection by and/or with the appropriate professionals.

Luxury dining rooms

Manhattan Beach September Home Sales and Prices

See all of the homes that sold in Manhattan Beach in September 2022

19 sold homes at and average price of $4,241,012

Welcome to the September recap for the homes that sold in Manhattan Beach CA.

Manhattan Beach is most definitely a luxury real estate  market but even by those standards, it was an impressive month.

The average price of the homes that sold during the month was an incredible $4,241,012.

September was a much slower month in terms of the actual number of home sales with only 19 homes selling during the month….down from 24 in August which was already down from prior months.

The average asking price during the month was an incredible $4,235,474 with the average sold price at $4,241,012.

  See how this compares to other months on our Manhattan Beach real estate trends and statistics page.

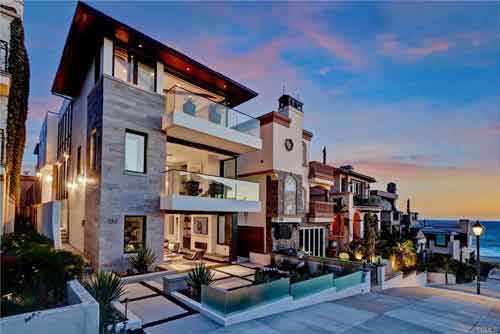
Manhattan Beach walkstreet homes

19 Home Sales in Manhattan Beach During September 2022

Home Type AddressSold Price$ Per footBed/BathSq FeetYear Built
SFR32120th PL$2,516,000$1,3444/2,0,1,01872/A1961/ASR
TWNHS2604Alma AV$5,100,000$1,9614/2,1,1,02601/D2022/BLD
SFR1404Manhattan AV$5,150,000$5,9262/2,0,0,0869/A1936/ASR
TPLX42420th ST$7,650,000$1,2608/8,0,2,06073/A1978/ASR
SFR31217th ST$8,000,000$2,2703/3,0,1,03524/A2011/SEE
SFR33317th Street$9,500,000$2,0664/5,0,1,04599/A2019/ASR
SFR2412 NArdmore AV$1,748,225$1,8842/1,0,0,0928/A1947/PUB
SFR64033rd ST$2,600,000$1,5204/3,0,0,01710/A1947/ASR
SFR2213 NValley DR$3,275,000$1,1374/3,0,0,02880/A1978/ASR
SFR59326th ST$3,470,000$1,6453/2,0,2,02110/A1951/ASR
SFR2317Pine AV$3,495,000$1,3384/3,0,0,02613/A1963/PUB
SFR2310Laurel Bluff$3,500,000$9544/3,0,0,03667/P1991/PUB
SFR3112Maple AV$4,100,000$1,2245/4,0,0,03350/B2005/ASR
SFR84912th CT$4,750,000$1,3465/5,0,1,03528/A2019/PUB
SFR1145Fisher AV$5,400,000$1,0775/6,0,0,05014/T2008/ASR
SFR1630Marine Av$1,725,000$1,0273/1,1,0,01680/A1952/ASR
SFR1340Marine AV$2,100,000$1,0233/2,0,1,02053/A1948/PUB
SFR135117th ST$3,100,000$9934/3,0,1,03122/E1992/EST
SFR2004Manzanita LN$3,400,000$1,1105/3,0,1,03062/A1997/ASR

Any information relating to a property referenced on this web site comes from CRMLS. This web site may reference real estate listing(s) held by a brokerage firm other than the broker and/or agent who owns this website. The accuracy of all information is deemed reliable but not guaranteed and should be personally verified through personal inspection by and/or with the appropriate professionals.

Take a Look At February’s Manhattan Beach Home Sales

Manhattan Beach home sales in February 2022

Let’s take a look at the home sales in Manhattan Beach during this past month.  The number of home sales was slow but an improvement over January.  There were 24 home sales on the MLS during the monnth compared with 17 in January.

The average “asking” price was a pretty incredible $4,018,917 with the average sold price at $4,067,648 meaning that homes generally sold  above the original list price indicating that it is definitely still a sellers market.   The average price per foot was $1,568 and avera days on market was 37

See how February 2022 ranked with recent months at our Manhattan Beach real estate trends and statistics page.

Search the current homes for sale in Manhattan Beach CA

February 2022 Manhattan Beach Home Sales and Property Prices 

Type Address Price $ Per Sq Ft Bed/Bath Sq Feet Year Sold Date
SFR/D 440 31st ST $3,700,000 $1,027.78 5/4,0,0,0 3600/A 1930/ASR 2/1/2022
SFR/D 509 Marine AVE $4,351,000 $1,041.16 6/2,3,0,0 4179/D 2021/BLD 2/23/2022
SFR/D 501 5th ST $4,475,000 $998.22 4/5,0,1,0 4483/A 1990/ASR 2/23/2022
SFR/D 341 4th ST $4,554,000 $5,180.89 2/1,0,0,0 879/A 1937/ASR 2/11/2022
TWNHS/A 201 34TH $5,700,000 $2,035.71 4/3,0,1,0 2800/D 2022/ASR 2/7/2022
DPLX/D 220 16th ST $5,750,000 $2,128.84 5/4,0,0,0 2701/A 1964/PUB 2/10/2022
SFR/D 420 31st ST $5,856,550 $1,300.88 5/1,4,1,0 4502/A 2017/ASR 2/18/2022
SFR/D 4104 The Strand $6,230,000 $3,198.15 3/2,0,0,0 1948/A 1938/ASR 2/2/2022
TWNHS/A 205 34th $6,450,000 $2,098.93 3/3,0,1,0 3073/D 2022/ASR 2/7/2022
SFR/D 420 5th ST $6,845,000 $1,598.55 5/2,3,2,0 4282/B 2021/BLD 2/1/2022
SFR/D 1500 Walnut AVE $2,600,000 $2,145.21 3/2,0,0,0 1212/A 1947/ASR 2/28/2022
SFR/D 600 29th ST $2,600,000 $1,108.27 2/2,0,0,0 2346/A 1952/ASR 2/28/2022
SFR/D 2908 Laurel AVE $2,700,000 $1,360.89 3/2,0,1,0 1984/A 1974/ASR 2/23/2022
SFR/D 636 27th ST $3,225,000 $948.25 4/3,0,0,0 3401/A 1987/ASR 2/23/2022
SFR/D 1501 Elm AVE $3,850,000 $1,306.41 4/4,0,1,0 2947/A 2018/ASR 2/17/2022
SFR/D 617 36th ST $4,201,000 $1,147.81 6/6,0,1,0 3660/A 2022/BLD 2/18/2022
TWNHS 10 DOVER PL $1,550,000 $1,148.15 2/2,0,0,0 1350/ 1987 2/18/2022
TWNHS/A 8 Dover Place $1,770,000 $1,220.69 2/2,0,0,0 1450/B 1987/ASR 2/3/2022
SFR/D 1701 Ruhland $2,500,000 $1,170.96 4/1,1,0,0 2135/E 1950/ASR 2/15/2022
SFR/D 461 S Prospect AVE $2,750,000 $1,394.52 4/1,2,1,0 1972/P 1955/PUB 2/8/2022
SFR/D 357 S Meadows AVE $2,929,000 $826.00 4/3,0,1,0 3546/A 1963/ASR 2/2/2022
SFR/D 1300 8th ST $3,312,000 $1,192.22 4/3,0,1,0 2778/A 1953/ASR 2/4/2022
SFR/D 1247 6th ST $4,250,000 $972.76 4/5,0,0,0 4369/A 2007/PUB 2/23/2022
SFR/D 1618 11th ST $5,475,000 $1,093.47 7/6,0,1,0 5007/B 2022/BLD 2/18/2022

The agent providing the information contained herein may not have been a buyer’s and/or seller’s agent. This report is based on data pulled from CRMLS on 3/7/22

42 Home Sales in Manhattan Beach During October

The hot real estate market in Manhattan Beach and the South Bay shows no signs of slowing down.    It was a great month for home sales in Manhattan Beach CA with a very impressive 42 MLS property sales closing.  Take a look at all of the homes that sold in Manhattan Beach during the month of October.   See how this compares with other months on our Redondo Beach real estate statistics and trends page.

The average “list” price was $3,869,643 with the average sold price at $3,882,792, indicating that homes still regularly closed escrow at prices higher than the asking price. The closed home sales averaged a brief 27 days on market (DOM) before going into pending status and  average dollar per foot of the homes that sold was $1599.   The highest sale of the month was a beachfront home on the Manhattna Beach Strand  at 508 The Strand which sold for $19,200,000.

View the current homes for sale in Manhattan Beach California

October 2021 Home Sales and Property Prices in Manhattan Beach CA

Type Address Price $ Per Foot Bed/Bath Sq Feet Year Sold Date
TWNHS/A 748 Manhattan Beach BLVD #A $1,705,000 $1,209.22 3/1,1,1,0 1410/A 1977/ASR 10/29/2021
TWNHS/D 3512 Alma AVE $2,200,000 $1,172.08 3/3,0,0,0 1877/A 1985/ASR 10/26/2021
CONDO/A 3207 Crest DR $2,285,000 $1,273.69 3/3,0,0,0 1794/A 1986/ASR 10/14/2021
SFR/D 432 31st ST $2,300,000 $1,418.00 3/3,0,0,0 1622/A 1958/PUB 10/1/2021
SFR/D 4104 Highland AVE $2,800,000 $1,093.75 3/3,0,1,0 2560/A 1992/ASR 10/15/2021
SFR/D 220 23rd ST $2,969,000 $1,656.81 3/3,0,1,0 1792/A 2006/ASR 10/19/2021
TWNHS/A 310 32nd ST $3,350,000 $1,384.30 3/4,0,0,0 2420/A 2006/ASR 10/13/2021
TWNHS/A 216 1st ST $3,375,000 $1,739.69 3/4,0,0,0 1940/A 2000/ASR 10/27/2021
SFR/D 432 35th ST $3,825,000 $1,380.37 3/2,0,1,0 2771/A 2002/ASR 10/27/2021
TWNHS/A 2215 Bayview DR $4,480,000 $1,703.42 4/3,0,0,1 2630/A 2007/ASR 10/4/2021
SFR/D 428 36th ST $4,547,000 $1,118.85 4/2,2,1,0 4064/D 2021/BLD 10/29/2021
TWNHS/A 2617 Vista DR $5,000,000 $1,901.14 4/4,0,0,0 2630/A 2017/ASR 10/5/2021
SFR/D 124 8th ST $5,000,000 $2,840.91 3/2,0,0,0 1760/A 1909/ASR 10/1/2021
SFR/D 124 8th ST $5,100,000 $2,897.73 3/2,0,0,0 1760/A 1909/ASR 10/21/2021
SFR/D 516 21st ST $5,150,000 $1,454.80 4/3,0,1,0 3540/B 2008/BLD 10/18/2021
SFR/D 228 20th Street $5,313,750 $1,282.28 5/4,0,1,0 4144/A 1999/ASR 10/15/2021
SFR/D 436 7th ST $5,595,000 $1,832.62 4/4,0,0,0 3053/A 2003/ASR 10/19/2021
SFR/D 508 The Strand $19,200,000 $4,439.31 5/2,3,1,0 4325/B 2021/BLD 10/15/2021
SFR/D 3609 Oak Ave. $1,510,000 $1,386.59 3/1,0,1,0 1089/A 1955/ASR 10/21/2021
SFR/D 768 Rosecrans AVE $1,575,000 $1,806.19 3/1,0,0,0 872/A 1954/PUB 10/19/2021
SFR/D 757 35th ST $2,025,000 $1,763.94 4/2,1,0,0 1148/A 1951/ASR 10/26/2021
SFR/D 3600 Pine AVE $2,200,000 $1,419.35 4/2,0,0,0 1550/S 1951/ASR 10/4/2021
SFR/D 1609 Walnut AVE $2,500,000 $1,349.89 3/2,0,0,0 1852/A 1964/ASR 10/1/2021
SFR/D 3509 N Poinsettia AVE $2,925,000 $1,114.71 4/2,2,0,0 2624/A 1959/ASR 10/14/2021
SFR 3013 N Poinsettia AVE $3,300,000 $1,061.09 5/4,0,0,0 3110/ 1950 10/22/2021
SFR/D 2304 Elm AVE $3,585,000 $1,070.47 5/4,0,0,0 3349/A 2000/ASR 10/27/2021
SFR/D 609 15th ST $3,625,000 $1,132.81 5/1,3,0,0 3200/S 1957/ASR 10/12/2021
SFR/D 647 15th ST $4,000,000 $1,090.22 5/4,0,0,0 3669/A 2005/ASR 10/7/2021
SFR/D 2101 Agnes RD $4,800,000 $1,027.62 5/4,0,1,0 4671/A 2017/PUB 10/18/2021
SFR/D 656 17th ST $7,050,000 $1,397.98 6/5,0,0,2 5043/B 2020/ASR 10/1/2021
TWNHS/D 234 Larsson ST $1,975,000 $856.09 3/2,0,1,0 2307/A 1980/ASR 10/22/2021
SFR/D 511 N Dianthus ST $2,300,000 $1,206.08 3/3,0,0,0 1907/A 1964/PUB 10/25/2021
SFR/D 938 Duncan AVE $4,350,000 $808.40 5/5,0,0,0 5381/T 1986/ASR 10/29/2021
SFR/D 714 N Dianthus ST $4,604,000 $1,241.30 5/4,0,1,0 3709/P 2018/BLD 10/28/2021
SFR/D 917 10th ST $8,000,000 $6,172.84 6/2,4,2,0 1296/A 2022/BLD 10/13/2021
TWNHS/A 11 Cordoba CT $1,852,500 $987.47 3/3,0,0,0 1876/A 1987/ASR 10/27/2021
CONDO 1315 Manhattan Beach BLVD #B $1,130,000 $961.70 2/3,0,0,0 1175/ 1986 10/29/2021
SFR/D 1809 Magnolia AVE $3,500,000 $1,031.84 4/5,0,0,0 3392/A 2008/ASR 10/18/2021
SFR/D 1325 11th ST $1,906,000 $1,339.42 4/2,0,0,0 1423/A 1952/ASR 10/19/2021
SFR/D 1608 3rd ST $1,950,000 $2,437.50 2/1,0,0,0 800/A 1938/PUB 10/21/2021
SFR/D 1190 Duncan DR $3,995,000 $1,963.14 3/2,0,0,0 2035/A 1962/ASR 10/14/2021
SFR 1603 6Th ST $4,225,000 $746.99 6/5,0,0,0 5656/E 1990 10/29/2021
559 31st Manhattan Beach

New Listing in the Tree Section at 551 31st St Manhattan Beach

“Go Big” is the motto of this latest listing both in terms of size and price.  The newest addition to the Manhattan Beach tree section is a 2019 built high end single family home located at 559 31st St.  The home was disigned by Mark Trotter and built by Icaza Construction and offers 6 bedrooms all with en suite baths,  office,  8 total bathrooms, and a private guest suite over the garage.  The home is immense with just under 5,000 square feet on 3 levels including a massive entertainers basement level.  The asking price is pretty significant at $6,195,000 and this would make it one of the highest priced (non ocean view) homes ever to sell in the tree section.  The home sold new in 2019 for $5,200,000. It’s a beautiful home with a great gas light neighborhood location but it will have to be seen if the market will support the $6.2M price.  As there’s nothing comparable on the market it may just be the perfect fit for someone willing to chase it.

Contact Manhattan Beach Realtor Keith Kyle for more information or to schedule a private tour

View all of the current Manhattan Beach tree section  homes for sale

559 31st St, Manhattan Beach – Listed at $6,195,000

Listing courtesy of Lee LeGrande – Palm Realty Boutique 310-545-2490

September Real Estate Recap for Manhattan Beach

Take a look at our overview of the month that was for real estate in Manhattan Beach CA during the month of September 2021.  While it was a bit of a down month for the number of homes that closed escrow, it was a very impressive month in terms of home prices.     There were 43 homes that sold during the month which was lower than  the 61 that closed in September 2020 but median sales price was WAY do primarily to several oceanfront  homes selling on the Manhattan Beach Strand during the month.  The median sales price was $3,954,000 which was dramatically higher than the already impressive $3,058,000 from a year earlier.  See how this compares with other months on our Manhattan Beach real estate trends page.

Search the current Manhattan Beach homes for sale

Manhattan Beach real estate at a glance

See the Homes that Sold in Manhattan Beach During September 2021

Welcome to the month that was for real estate in Manhattan Beach.  It was another impressive showing for home sales in Manhattan Beach CA.

There were 44 on market home sales which is a very impressive month.   The average list price was $3,999,739 with the average sold price at $3,934,8363. Homes averaged only 45 days on market before going into escrow.  The top sale of the month was a beachfront home located at 2316 The Strand, Manhattan Beach 90266 which closed at $16,500,000. The low sale was a 2 bedroom townhome in east Manhattan that closed at $1,090,000.  4 of the homes were beachfront on The Strand.

See how it compares with other months on our Manhattan Beach real estate trends page

Search the current homes for sale in Manhattan Beach

Property Prices and Home Sales in Manhattan Beach

MLS Type Address Price $ Per Ft Bed/Bath Sq Feet Year Sold Date
SB21161742 TWNHS/A 3612 Alma AVE $2,675,000 $1,065.74 4/4,0,0,0 2510/A 2006/ASR 9/14/2021
SB21046749 SFR/D 228 29th ST $3,000,000 $3,359.46 1/1,0,0,0 893/A 1951/ASR 9/9/2021
SB21190702 CONDO/A 4230 The Strand $3,215,000 $2,001.87 3/3,0,0,0 1606/A 1978/PUB 9/30/2021
SB21099557 SFR/D 552 3rd ST $3,275,000 $1,563.25 3/1,1,1,0 2095/OTH 1947/ASR 9/15/2021
SB21145512 SFR/D 229 25th Street $3,885,000 $2,751.42 3/2,1,0,0 1412/A 1940/ASR 9/10/2021
SB21101147 SFR/D 421 1st ST $3,900,000 $955.65 4/5,0,0,0 4081/AP 2005/PUB 9/3/2021
SB21160236 SFR/D 2304 Grandview AVE $4,082,500 $997.68 5/3,0,1,0 4092/A 1990/ASR 9/16/2021
SB21159136 SFR/D 225 27th ST $4,500,000 $1,982.38 4/2,0,0,0 2270/A 1937/ASR 9/30/2021
SB21197347 SFR/D 1904 Ocean Drive $4,900,000 $2,722.22 2/2,0,0,0 1800/P 2011/PUB 9/7/2021
SB21181582 CONDO/A 1149 The Strand $5,550,000 $2,881.62 2/2,0,0,0 1926/D 1991/ASR 9/24/2021
SB21112349 SFR/D 220 20th ST $6,100,000 $1,641.55 4/2,1,1,0 3716/A 1992/ASR 9/2/2021
EV21093291 CONDO/A 4112 The Strand $6,775,000 $2,656.86 4/4,0,0,0 2550/A 2008/ASR 9/16/2021
SB21170286 SFR/D 325 6th ST $7,250,000 $1,550.80 4/3,1,1,0 4675/P 2017/ASR 9/22/2021
SB21080239 SFR/D 2508 The Strand $12,225,000 $2,684.45 4/5,0,1,0 4554/A 2009/ASR 9/3/2021
SB20237016 SFR/D 2316 The Strand $16,500,000 $2,887.14 6/2,3,2,0 5715/T 2016/SLR 9/10/2021
OC21136993 SFR/D 600 26th ST $1,975,000 $1,410.71 3/2,0,0,0 1400/A 1959/PUB 9/8/2021
SB21146296 SFR/D 1829 Oak AVE $2,200,000 $1,571.43 3/2,0,0,0 1400/E 1947/ASR 9/3/2021
SB21104964 SFR/D 632 35th ST $2,580,000 $642.91 4/3,0,0,0 4013/A 1989/ASR 9/14/2021
SB21071464 SFR/D 3504 Laurel AVE $2,750,500 $904.47 3/3,0,0,0 3041/A 1982/ASR 9/29/2021
SB21171314 SFR/D 3521 Palm AVE $2,815,000 $1,014.41 4/3,0,0,0 2775/A 1995/ASR 9/14/2021
SB21137408 SFR/D 754 35th ST $3,042,960 $895.78 5/3,0,0,0 3397/A 2019/SEE 9/2/2021
SB21167437 SFR/D 2812 Maple AVE $3,500,000 $971.68 5/3,0,1,0 3602/A 1988/ASR 9/15/2021
SB21167191 SFR/D 2322 Laurel Bluff DR $3,532,322 $1,066.52 4/3,0,2,0 3312/A 1995/ASR 9/10/2021
SB21182722 SFR/D 608 26th ST $3,600,000 $957.96 5/4,0,1,0 3758/A 1996/ASR 9/1/2021
SB21198069 SFR/D 2916 Palm AVE $3,712,500 $1,084.89 5/4,0,0,0 3422/A 2004/ASR 9/8/2021
SB21141914 SFR/D 583 35th ST $4,000,000 $1,023.28 4/1,3,1,0 3909/A 2004/APP 9/1/2021
SB21164514 SFR/D 605 29th ST $5,500,000 $1,099.56 5/5,0,1,0 5002/A 2017/ASR 9/13/2021
SB21061855 SFR/D 1023 1st ST $4,155,000 $3,135.85 2/1,0,0,0 1325/A 1950/ASR 9/15/2021
SB21106887 SFR/D 853 10th ST $8,050,000 $1,058.37 7/4,2,4,0 7606/B 2001/ASR 9/17/2021
SB21176484 TWNHS/A 17 Cordoba CT $1,325,000 $904.44 2/2,0,0,0 1465/A 1987/ASR 9/20/2021
SB21176421 TWNHS/A 30 Monterey CT $1,359,000 $921.98 2/1,1,0,0 1474/A 1987/ASR 9/28/2021
21772922 TWNHS 38 Fairway DR $2,005,000 $1,101.65 3/2,1,0,0 1820/B 1985/ASR 9/14/2021
PW21108357 SFR/D 16 Bridgeport $2,950,000 $1,007.86 3/2,0,1,0 2927/AP 1983/ASR 9/16/2021
SB21102526 TWNHS/A 1427 12th ST #1 $1,090,000 $816.48 2/3,0,0,0 1335/A 1984/ASR 9/16/2021
SB21149041 SFR/D 1509 Faymont AVE $1,670,000 $1,530.71 3/1,0,0,0 1091/A 1950/ASR 9/7/2021
SB21153043 SFR/D 1904 Manzanita LN $2,049,000 $1,125.82 3/2,0,0,0 1820/A 1950/ASR 9/13/2021
SB21151359 SFR/D 1909 Faymont $2,200,000 $1,208.13 3/2,0,0,0 1821/A 1950/ASR 9/20/2021
SB21174106 SFR/D 1713 23rd ST $2,615,000 $1,381.41 4/3,0,0,0 1893/A 1950/ASR 9/20/2021
SB21193120 SFR/D 1400 17th ST $3,500,000 $1,067.72 5/3,2,0,0 3278/B 2021/PUB 9/1/2021
SB21100628 SFR/D 1772 Curtis AVE $1,694,000 $1,001.77 4/2,0,1,0 1691/A 1955/ASR 9/3/2021
SB21167680 SFR/D 1545 3rd ST $2,200,000 $983.46 4/2,0,0,0 2237/A 1962/ASR 9/9/2021
SB21184322 SFR/D 1541 Voorhees AVE $2,320,000 $2,832.72 2/1,0,0,0 819/A 1952/ASR 9/17/2021
SB20077776 SFR/D 428 Altura WAY $3,100,000 $1,030.93 4/0,2,0,0 3007/P 1955/ASR 9/30/2021
SB21132177 SFR/D 1226 3rd ST $3,900,000 $975.00 6/5,0,0,0 4000/A 2019/ASR 9/10/2021

View the Home Sales in Manhattan Beach During January

Let’s take a look how the year started for real estate in the luxury coastal community of Manhattan Beach CA. View the homes, townhomesmanhattanhomes and income properties that sold during the first month of 2021.  It was a solid, although slower, month especially given that December is often a down month for homes going into escrow.  There were 18 property sales in Manhattan Beach during January.  The median “list” price was $3,347,500 with the median “sold” price at $3,382,500 indicating a very solid “seller’s” market. The median price per foot of the homes that sold was $1,541. See how January home prices compare with previous months on our Manhattan Beach real estate trends and statistics page.
The most expensive sale of the month, by far, was the beachfront corner lot at 1920 The Strand that sold for $16,250,000.  It’s certainly not a surpise when a beachfront home sells in Manhattan Beach and it’s  the highest sale.

Search the current homes for sale in Manhattan Beach.

January Property Sales and Home Prices in Manhattan Beach

Type Address Price $ Per Sq Foot Bed/Bath Sq Feet Year Sold Date
TWNHS/A 17 Cordoba CT $1,150,000 $784.98 2/2,0,0,0 1465/A 1987/ASR 1/5/2021
SFR/D 2201 N Valley DR $1,510,000 $1,613.25 3/1,0,0,0 936/A 1947/ASR 1/22/2021
TWNHS/A 12 Dover PL $1,570,000 $830.25 3/2,1,0,0 1891/AP 1987/ASR 1/14/2021
TWNHS/D 2605 Alma AVE #2 $1,747,000 $1,255.03 3/1,2,0,0 1392/T 1969/ASR 1/15/2021
SFR/D 2616 Pine AVE $2,076,000 $1,550.41 3/1,1,0,0 1339/A 1956/ASR 1/29/2021
SFR/D 825 Duncan PL $3,050,000 $2,941.18 3/1,0,0,0 1037/A 1955/PUB 1/26/2021
SFR/D 1405 Oak AVE $3,055,000 $981.05 4/4,0,0,0 3114/A 2017/ASR 1/12/2021
SFR/D 3201 N Poinsettia AVE $3,099,000 $934.84 5/4,0,0,0 3315/A 1999/ASR 1/21/2021
SFR/D 341 6th Street $3,380,000 $2,424.68 4/2,0,0,0 1394/A 1948 1/26/2021
SFR/D 1901 Elm AVE $3,385,000 $1,036.44 5/4,0,1,0 3266/B 2020/BLD 1/14/2021
SFR/D 653 26th ST $3,450,000 $985.71 5/3,1,1,0 3500/P 1999/ASR 1/5/2021
SFR/D 401 6th ST $3,560,000 $1,887.59 4/2,0,0,0 1886/A 1948/ASR 1/22/2021
TWNHS/A 309 Crest Drive $3,795,000 $1,533.33 4/3,0,1,0 2475/B 2020/BLD 1/12/2021
SFR/D 716 Manhattan AVE $3,875,000 $1,686.25 3/3,0,0,0 2298/T 2012/SEE 1/5/2021
SFR/D 868 5th ST $4,200,000 $1,416.53 4/2,0,1,0 2965/A 1968/ASR 1/7/2021
SFR/D 235 4th ST $6,990,000 $1,690.45 4/4,0,2,0 4135/A 2019/ASR 1/20/2021
SFR/D 125 8th ST $7,790,000 $1,907.91 5/3,2,1,0 4083/A 2012/ASR 1/12/2021
SFR/D 1920 The Strand $16,250,000 $2,915.32 5/6,0,1,0 5574/A 2002/ASR 1/15/2021
Manhattan Beach real estate market

Manhattan Beach Real Estate Market Overview

August was a big month for home sales and home prices in the luxury community of Manhattan Beach.  47 homes and properties sold during the month which was impressive on it’s own.  Combined with a median sales price of $3,221,000 and that really made August a record month for the past few years.  View the homes that sold during August in Manhattan Beach.

View the current homes for sale in Manhattan Beach