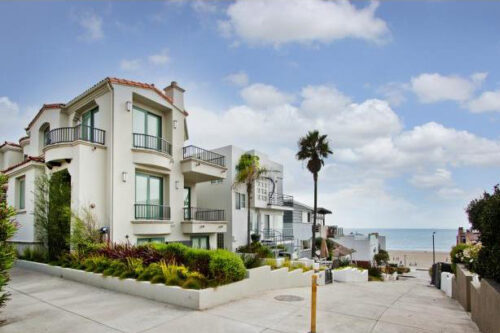
Beachfront investment properties on the Strand

See The 24 Manhattan Beach Home Sales in April 2025

24 Homes Sell in April in Manhattan Beach

Average Price of $3,765,625

Welcome to the April 2025 real estate report for the city of Manhattan Beach.

The market slowed a bit in terms of the number of homes that sold although the average prices were impressive as usual.

There were 24 closed escrows in Manhattan Beach in April  compared to 34 in March, and 33 in February.

The average “asking” price was $3,818,250 with the average sold price at $3,765,625 which was up from $3,513,775 in March but a big drop from $4,257,657 in February and a huge drop from the rediculous January average home price of $5,323,450 in January.

Homes averaged $1,684 per square foot which was up from prior months.

Homes averaged a fairly brief 35 days on market before going into escrow with a median of only 9  days.

April 2025 home sales in Manhattan Beach

Home type Address Price Bedsaths Sq Feet Year Built
DPLX/D 225 9th ST $2,550,000 3/1,1,0,0 1452 1956
SFR 516 2nd ST $3,025,000 2/1,0,0,0 1290 1934
SFR 525 21st St $3,050,000 3/1,0,0,0 1084 1947
TWNHS 429 21st PL $3,550,000 3/3,0,1,0 1890 2006
SFR 117 Crest DR $4,350,000 4/4,0,1,0 2520 2013
TPLX 113 25th Street $4,400,000 4/2,1,0,0 2105 1929
TWNHS 440 24th ST #1 $4,600,000 4/3,0,1,0 2514 2018
SFR 304 The Strand $13,350,000 4/4,0,1,0 2829 1952
SFR 3313 Pacific AVE $1,750,000 3/3,0,0,0 1856 1950
SFR 3002 N Ardmore AVE $1,900,000 3/2,0,0,0 1121 1956
SFR 620 25th ST $2,200,000 2/1,0,0,0 912 1947
SFR 3001 N Valley DR $2,900,000 3/2,0,0,0 2000 1952
SFR 724 35th ST $3,100,000 3/2,0,0,0 1589 1948
SFR 720 36th ST $3,550,000 4/3,0,0,0 2586 1953
SFR 3108 Pacific AVE $3,620,000 4/2,1,1,0 3459 2000
SFR 605 33rd ST $4,355,000 5/5,0,0,0 3745 2005
SFR 719 11th ST $6,000,000 5/4,0,1,0 5697 1990
TWNHS 29 Laguna CT $1,500,000 2/2,0,0,0 1488 1984
TWNHS 23 Catalina CT $1,525,000 2/3,0,0,0 1557 1984
SFR 1716 Curtis AVE $2,000,000 4/1,0,0,0 1252 1951
SFR 1504 Mathews AVE $3,300,000 4/4,0,1,0 2585 1954
SFR 520 Johnson ST $3,575,000 5/1,2,1,0 3126 1967
SFR 1515 Ruhland AVE $4,500,000 5/5,0,0,0 4767 1990
SFR 1826 9th ST $5,725,000 6/6,0,1,0 4650 2025

Any information relating to a property referenced on this web site comes from CRMLS. This web site may reference real estate listing(s) held by a brokerage firm other than the broker and/or agent who owns this website. The accuracy of all information is deemed reliable but not guaranteed and should be personally verified through personal inspection by and/or with the appropriate professionals.

Luxury homes in Manhattan Beach

February 2025 A Great Month For Manhattan Beach Real Estate

February 2025 Real Estate Market Recap

Manhattan Beach Home Sales and Prices

33 sold homes in Manhattan With an Average Price of $4,257,657

The Manhattan Beach real estate market really picked up the pace in February 2025 after a slower (but expected) January.

February saw 33 home sales in Manhattan Beach compared with 20  in January.

The average listing price was $4,272,333 with the average sold price at $4,257,657.

The average price per square foot was $1482.

Homes averaged 58 days on market before going into escrow with a median of only 17  days.

Of the 33 home sales, 14 were in the Manhattan Beach sand section, 6 in the tree section, 3 in the gated community of Manhattan Village  with 8 in east Manhattan Beach and Liberty Village.

See how this compares to other months on our Manhattan Beach real estate trends and statistics page.

Manhattan Beach Home Sales in February 2025

Type Address Price Beds/Baths Sq Feet Year built
SFR/D 817 N Valley DR $2,495,000 3/2,0,0,0 1420 1955
TWNHS/A 125 15th ST $2,899,000 3/2,0,1,0 1657 1981
SFR/D 125 38th ST $3,000,000 3/3,0,0,0 1838 1977
SFR/D 527 24th ST $3,325,000 4/2,0,0,0 2106 1963
QUAD/A 220 14th ST $3,900,000 4/4,0,0,0 2628 1959
SFR 472 29TH ST $4,600,000 5/6,0,0,0 4603 2003
SFR/D 429 5th ST $5,600,000 5/4,0,0,0 3255 1996
TWNHS/D 2400 Alma AVE $5,825,000 4/3,0,1,0 2818 2012
SFR/D 441 34th ST $6,500,000 4/6,0,0,0 3599 2021
SFR/D 301 16th ST $8,000,000 6/7,0,0,0 6289 1990
SFR/D 215 19th ST $8,072,075 4/5,0,0,0 4264 2002
SFR/D 528 5th ST $8,500,000 5/2,2,1,0 4218 2025
SFR/D 100 Morningside DR $8,900,000 6/5,0,1,0 5366 2014
SFR/D 405 7th ST $9,125,000 4/4,0,1,0 4254 2024
SFR 2413 John ST $3,180,000 4/2,0,0,0 1890 1961
SFR/D 2413 John ST $3,180,000 3/2,0,0,0 1890 1961
SFR/D 3525 Walnut AVE $3,200,000 5/3,1,0,0 3509 2001
SFR/D 3008 N Ardmore AVE $3,575,000 3/2,0,0,0 1906 1955
SFR/D 757 35th Street $5,000,000 5/6,0,1,0 4000 2024
SFR/D 2512 Palm AVE $5,500,000 5/5,0,1,0 3295 2017
TWNHS/A 26 Monterey CT $1,345,000 2/2,0,1,0 1557 1987
TWNHS/A 3 Evergreen LN $2,315,000 3/2,0,1,0 2064 1985
SFR/D 28 Chatham $3,592,500 3/3,0,0,0 3306 1983
SFR/D 1624 22nd ST $1,700,000 3/1,0,0,0 1054 1952
CONDO 1150 N Rowell AVE $1,860,000 3/2,0,1,0 1960 2016
SFR 1151 N Meadows AVE $1,929,100 4/3,0,0,0 1812 1947
SFR/D 2104 Chestnut Avenue $2,410,000 4/2,0,1,0 2055 1948
SFR/D 1146 18th St $3,370,000 4/3,0,0,0 2094 1948
SFR/D 460 Chabela DR $2,420,000 3/2,0,0,0 1764 1955
SFR/D 1737 Voorhees AVE $2,600,000 4/2,0,0,0 1904 1952
SFR/D 1500 2nd ST $2,635,000 4/2,0,1,0 1609 1961
SFR/D 1701 5th ST $3,750,000 5/5,0,1,0 3274 2024
SFR/D 1751 8th ST $6,200,000 6/5,0,1,0 5826 2019
Any information relating to a property referenced on this web site comes from CRMLS. This web site may reference real estate listing(s) held by a brokerage firm other than the broker and/or agent who owns this website. The accuracy of all information is deemed reliable but not guaranteed and should be personally verified through personal inspection by and/or with the appropriate professionals
Manhattan Beach luxury homes

21 Homes Sell in Manhattan Beach CA in Slower December

Manhattan Beach Real Estate Market Recap

21 home sales in Manhattan at $3,292,631 average price

Unlike some other South Bay cities, December 2024 was a down month for the number of homes that sold and the prices that they sold for.  That will definitely change in January and February.

There were 21 home sales compared with 25 closed escrows in November.

The average asking price was $3,369,810 with the average sold price at $3,292,631 meaning homes generally sold below the list price.  This was also a decrease from $3,327,260  in November and an incredible $4,336,226 average price in October and  $4,647,847 in September.   

The average price per square foot was $1,378 which was up from $1251 in November but down from September and October.

Homes averaged a fairly lengthy 49 days on market before going into escrow.

Manhattan Beach luxury homes

December 2024 Manhattan Beach home sales and prices

Type Address Price Beds/Baths Sq Feet Yr Built
SFR/D 120 Highland AVE $3,475,000 4/1,2,0,0 2724/P 1998
CONDO/D 3305 Bayview DR $3,500,000 4/4,0,1,0 1892/A 1994
SFR/D 216 Morningside DR $3,650,000 4/4,0,1,0 3600/A 2001
SFR/D 1704 Highland AVE $4,150,000 4/3,0,1,0 3308/A 2001
SFR/D 3521 Pacific $1,800,000 2/1,0,0,0 1182/SEE 1948
SFR 3613 Oak AVE $2,215,000 3/2,0,0,0 1403/ 1948
SFR/D 1808 Laurel AVE $2,800,000 3/1,1,0,0 1399/AP 1952
SFR/D 1901 Laurel AVE $3,511,250 4/3,0,0,0 2512/A 1961
SFR/D 2209 N Valley DR $3,520,000 4/2,0,1,0 3524/A 1980
SFR/D 633 35th ST $3,630,000 4/1,3,1,0 2428/S 2018
SFR/D 613 18th ST $5,378,000 4/4,0,0,0 3190/A 1998
SFR/A 857 11th ST $2,835,000 3/3,0,0,0 2184/A 1947
SFR/D 819 11th ST $5,950,000 6/5,0,2,0 4997/A 1998
SFR/D 1612 Harkness ST $1,900,000 2/1,0,0,0 883/A 1950
SFR 1301 19th ST $2,609,000 3/2,0,0,0 1671/OTH 1949
SFR/D 1631 19th ST $3,350,000 5/4,0,0,0 3563/A 2014
TWNHS/A 1440 12th ST #A $1,380,000 2/3,0,0,0 1534/A 1980
SFR/D 1627 1st $1,950,000 3/1,1,0,0 1176/P 1951
SFR 1643 5th ST $2,781,000 4/2,0,1,0 3058/ 1979
SFR/D 300 Carriage PL $3,136,000 4/2,1,1,0 2982/A 1976
SFR/D 1504 9th ST $5,625,000 5/2,2,1,0 4662/B 2024
Any information relating to a property referenced on this web site comes from CRMLS. This web site may reference real estate listing(s) held by a brokerage firm other than the broker and/or agent who owns this website. The accuracy of all information is deemed reliable but not guaranteed and should be personally verified through personal inspection by and/or with the appropriate professionals
Manhattan Beach walkstreet homes

Manhattan Beach Real Estate Market Report for October

42 home sales in Manhattan Beach in October

Amazing Average Price of $4,336,226

October was yet another fantastic month for the real estate market in Manhattan Beach California.

There were 42 on market home sales during the month which is the highest in 2024.

The top home sale of the month was a beachfront home at 1508 The Strand that was listed for $13,749,000 and sold for $12,337,500.  The beachfront home had been in the midst of a renovation when the project was stopped so it was definitely a fixer.

The average “list” price of the homes that sold was an incredible $4,491,286 with the average sold price at $4,336,226 which…..believe it or not was a sizable drop from $4,647,847 in September.   

The average price per square foot was $1,400 which was down from $1,525 in September, but up from $1,312 in August.  Ironically homes averaged a fairly lengthy 72 days on market before going into escrow which was double the norm for 2024.

Of the 42 homes that sold, 14 were in the Manhattan Beach sand section, only 3 in the tree section, an impressive 6 in the hill section, 1 court home in the gated community of Manhattan Village and the rest were located east of Sepulveda. .

See how this compares to other months on our Manhattan Beach real estate trends and statistics page.

October 2024 home sales in Manhattan Beach

Home style Address Sold Price Beds/Baths Sq Feet Age
SFR/D 461 32nd ST $3,000,000 3/2,0,1,0 2704/A 1986/ASR
TWNHS/A 413 21st PL $3,245,000 3/3,0,1,0 2085/B 2023/BLD
SFR/D 464 31 st. ST $3,800,000 4/4,0,1,0 4026/A 2003/ASR
SFR/D 432 32nd ST $4,110,000 5/3,0,1,0 4293/A 1988/ASR
TWNHS/A 2513 Vista Dr $4,150,000 4/3,0,1,0 2728/B 2024/BLD
TWNHS/A 1308 Manhattan AVE $4,500,000 3/3,0,1,0 2090/A 2009/ASR
TWNHS/A 302 11th ST $4,600,000 3/2,1,1,0 2600/O 2002/ASR
SFR/D 208 18th ST $5,000,000 5/2,1,1,0 2507/P 1950/PUB
SFR 224 18th ST $5,150,000 6/4,1,0,0 2634/ 1971
DPLX/D 224 18th ST $5,150,000 6/5,0,0,0 2634/A 1971/OTH
SFR/D 404 8th ST $5,500,000 5/2,2,1,0 3294/P 1997/PUB
TWNHS/A 401 26th ST $5,750,000 4/5,0,0,0 2682/A 2021/ASR
SFR/D 401 27th ST $9,375,000 4/3,1,2,0 6227/A 2002/ASR
SFR/D 1508 The Strand $12,337,500 5/5,0,1,0 5589/A 1988/ASR
SFR/D 1308 N Poinsettia AVE $2,950,000 3/3,0,1,0 2430/T 1958/PUB
SFR/D 1145 Pine AVE $3,475,000 4/3,0,0,0 2946/B 2021/BLD
SFR/D 763 31st $10,275,000 9/10,0,1,0 7308/T 1998/SEE
SFR/D 869 10th ST $2,500,000 4/2,0,0,0 1863/A 1950/PUB
SFR/D 1009 8th ST $4,450,000 5/4,0,1,0 4500/B 2004/ASR
SFR/D 856 9th ST $5,000,000 4/3,0,1,0 4300/A 1999/ASR
SFR/D 119 S Dianthus Ave. $5,150,000 3/2,0,0,0 2364/A 1971/ASR
SFR/D 1019 Duncan AVE $6,000,000 5/5,0,1,0 4586/A 2008/ASR
SFR/D 401 N Dianthus Street $8,995,000 6/5,0,2,0 6312/P 2019/ASR
CONDO/A 17 Lafayette Court $1,795,000 3/2,0,1,0 1916/B 1985/ASR
SFR/D 1621 22nd ST $1,800,000 3/2,0,0,0 1374/A 1952/ASR
SFR/D 1645 22nd ST $1,925,000 3/2,0,0,0 1566/A 1952/PUB
SFR/D 1205 N Meadows $2,500,000 3/2,0,0,0 1511/P 2014/PUB
SFR 1804 Faymont AVE $2,755,000 4/3,0,0,0 3317/ 1989
SFR/D 1821 Herrin ST $2,850,000 3/2,0,1,0 1960/A 1966/ASR
SFR/D 1720 Magnolia AVE $3,850,000 5/5,0,1,0 3267/B 2024/BLD
SFR/D 1561 2nd Street $1,345,000 2/1,0,0,0 812/P 1951/PUB
TWNHS/A 1623 Artesia BLVD #A $1,445,000 3/2,0,1,0 2210/A 2008/ASR
SFR/D 1777 Gates Ave. $2,030,000 3/2,0,0,0 1767/A 1968/ASR
SFR/D 1736 Voorhees AVE $2,100,000 3/1,0,0,0 996/A 1912/PUB
SFR/D 1320 1st ST $2,279,000 4/2,0,0,0 1973/A 1951/ASR
SFR/D 1637 1st ST $2,370,000 3/2,0,0,0 1402/A 1959/ASR
SFR/D 1230 9th ST $2,385,000 4/2,1,0,0 2195/A 1965/ASR
SFR/D 1511 3rd ST $3,155,000 4/4,0,0,0 2636/A 1952/PUB
SFR/D 1607 1st ST $3,275,000 5/4,0,1,0 3495/A 2006/ASR
SFR/D 1603 5th ST $4,200,000 5/4,0,1,0 4696/A 2000/ASR
SFR 1847 9th ST $5,300,000 6/6,0,1,0 5205/ 2024/BLD
SFR/D 1240 5th ST $10,300,000 7/7,0,1,0 10009/A 2003/ASR
Any information relating to a property referenced on this web site comes from CRMLS. This web site may reference real estate listing(s) held by a brokerage firm other than the broker and/or agent who owns this website. The accuracy of all information is deemed reliable but not guaranteed and should be personally verified through personal inspection by and/or with the appropriate professionals
Walkstreet homes in Manhattan Beach

Home Sales and Home Prices in Manhattan Beach in October

Manhattan Beach October Real Estate Report

11 Manhattan Beach Home Sales in October 2023

Welcome to the Manhattan Beach real estate market update for October.

It was a fairly slow month in terms of the number of closed escrows with only 11 home sales in October. Compare that to the number of homes that sold in September at 28 and 35 in August.

The average “asking price” in October was $3,496,182 with the average sold price at $3,423,670 compared to $3,275,107 in September.

The average price per square foot was down from August and was $1430 in September. Homes averaged only 21 days on market before going into escrow.

See how this compares to other months on our Manhattan Beach real estate trends and statistics page.

Manhattan Beach Home Sales and Home Prices

Home Type Address Price $ Per Foot Bed/Bath Sq Feet Age
TWNHS/A 315 Gull St $3,100,000 $1,223 3/3,0,1,0 2535/O 2006/ASR
TWNHS/A 221 4th PL $3,100,000 $1,240 3/2,1,1,0 2500/B 2001/ASR
CONDO 4406 The Strand $4,623,373 $2,162 3/2,0,1,0 2138/ 1992
TWNHS/D 412 Manhattan Ave $5,600,000 $2,240 4/1,3,1,0 2500/B 2023/BLD
SFR/D 2508 Pacific AVE $1,810,000 $1,407 3/1,1,0,0 1286/A 1950/ASR
SFR/D 2416 Palm AVE $2,355,000 $839 5/2,1,0,0 2808/T 1961/ASR
SFR/D 2701 N Valley DR $2,462,000 $1,307 4/2,1,0,0 1883/A 1963/ASR
SFR/D 118 N Ardmore AVE $2,550,000 $1,510 2/2,0,0,0 1689/A 1952/ASR
SFR/D 868 9th ST $8,495,000 $1,537 5/2,3,1,0 5526/P 2021
TWNHS/A 34 Bermuda Ct. $1,890,000 $910 3/2,0,1,0 2077/A 1987/ASR
SFR/D 1612 Magnolia AVE $1,675,000 $1,355 4/1,1,0,0 1236/A 1947/ASR
Any information relating to a property referenced on this web site comes from CRMLS. This web site may reference real estate listing(s) held by a brokerage firm other than the broker and/or agent who owns this website. The accuracy of all information is deemed reliable but not guaranteed and should be personally verified through personal inspection by and/or with the appropriate professionals.
Luxury dining rooms

Manhattan Beach September Home Sales and Prices

See all of the homes that sold in Manhattan Beach in September 2022

19 sold homes at and average price of $4,241,012

Welcome to the September recap for the homes that sold in Manhattan Beach CA.

Manhattan Beach is most definitely a luxury real estate  market but even by those standards, it was an impressive month.

The average price of the homes that sold during the month was an incredible $4,241,012.

September was a much slower month in terms of the actual number of home sales with only 19 homes selling during the month….down from 24 in August which was already down from prior months.

The average asking price during the month was an incredible $4,235,474 with the average sold price at $4,241,012.

  See how this compares to other months on our Manhattan Beach real estate trends and statistics page.

Manhattan Beach walkstreet homes

19 Home Sales in Manhattan Beach During September 2022

Home Type AddressSold Price$ Per footBed/BathSq FeetYear Built
SFR32120th PL$2,516,000$1,3444/2,0,1,01872/A1961/ASR
TWNHS2604Alma AV$5,100,000$1,9614/2,1,1,02601/D2022/BLD
SFR1404Manhattan AV$5,150,000$5,9262/2,0,0,0869/A1936/ASR
TPLX42420th ST$7,650,000$1,2608/8,0,2,06073/A1978/ASR
SFR31217th ST$8,000,000$2,2703/3,0,1,03524/A2011/SEE
SFR33317th Street$9,500,000$2,0664/5,0,1,04599/A2019/ASR
SFR2412 NArdmore AV$1,748,225$1,8842/1,0,0,0928/A1947/PUB
SFR64033rd ST$2,600,000$1,5204/3,0,0,01710/A1947/ASR
SFR2213 NValley DR$3,275,000$1,1374/3,0,0,02880/A1978/ASR
SFR59326th ST$3,470,000$1,6453/2,0,2,02110/A1951/ASR
SFR2317Pine AV$3,495,000$1,3384/3,0,0,02613/A1963/PUB
SFR2310Laurel Bluff$3,500,000$9544/3,0,0,03667/P1991/PUB
SFR3112Maple AV$4,100,000$1,2245/4,0,0,03350/B2005/ASR
SFR84912th CT$4,750,000$1,3465/5,0,1,03528/A2019/PUB
SFR1145Fisher AV$5,400,000$1,0775/6,0,0,05014/T2008/ASR
SFR1630Marine Av$1,725,000$1,0273/1,1,0,01680/A1952/ASR
SFR1340Marine AV$2,100,000$1,0233/2,0,1,02053/A1948/PUB
SFR135117th ST$3,100,000$9934/3,0,1,03122/E1992/EST
SFR2004Manzanita LN$3,400,000$1,1105/3,0,1,03062/A1997/ASR

Any information relating to a property referenced on this web site comes from CRMLS. This web site may reference real estate listing(s) held by a brokerage firm other than the broker and/or agent who owns this website. The accuracy of all information is deemed reliable but not guaranteed and should be personally verified through personal inspection by and/or with the appropriate professionals.

September Real Estate Recap for Manhattan Beach

Take a look at our overview of the month that was for real estate in Manhattan Beach CA during the month of September 2021.  While it was a bit of a down month for the number of homes that closed escrow, it was a very impressive month in terms of home prices.     There were 43 homes that sold during the month which was lower than  the 61 that closed in September 2020 but median sales price was WAY do primarily to several oceanfront  homes selling on the Manhattan Beach Strand during the month.  The median sales price was $3,954,000 which was dramatically higher than the already impressive $3,058,000 from a year earlier.  See how this compares with other months on our Manhattan Beach real estate trends page.

Search the current Manhattan Beach homes for sale

Manhattan Beach real estate at a glance

Home Sales and Property Prices in Manhattan Beach for July 2021

Welcome to the real estate recap for the month that was in July for home sales in Manhattan Beach. It was another amazing month for the Manhattan Beach real estate market as demand just never seems to slow.  There were 45 total on market sales that closed with 14 homes in the sand section,  8 homes in tree section, 7 home sales in the hill section, 1 in Manhattan Village and the rest were east of Sepulveda.   See how this compares with other months on our Manhattan Beach real estate trends page.

July 2021 Home Sales and Home Prices in Manhattan Beach

Type Address Price $ Per foot Bed/Bath Sq feet Year Date sold
TWNHS/A 304 3rd ST $5,500,000 $2,123.55 4/ 2590/A 2017/ASR 7/1/2021
SFR/D 587 36th ST $3,212,000 $1,590.10 3/2,0,1,0 2020/A 1984/ASR 7/1/2021
SFR/D 659 18th ST $4,250,000 $1,052.76 4/3,0,0,0 4037/A 1952/ASR 7/1/2021
SFR/D 406 Anderson ST $4,950,000 $1,150.09 5/4,0,0,0 4304/A 2008/ASR 7/1/2021
SFR/D 1120 5th ST $1,800,000 $595.43 4/3,0,0,0 3023/A 1982/PUB 7/1/2021
SFR/D 220 8th ST $9,200,000 $2,193.09 4/3,0,1,0 4195/A 2017/SLR 7/2/2021
SFR/A 24 Westport $3,100,000 $952.09 4/2,1,1,0 3256/A 1983/ASR 7/2/2021
SFR/D 1015 N Redondo AVE $1,379,000 $1,109.41 2/1,0,1,0 1243/A 1951/ASR 7/2/2021
DPLX/D 4305 Crest DR $2,125,000 $1,135.15 4/2,0,1,0 1872/A 1972/ASR 7/7/2021
SFR/D 400 Highland AVE $3,175,000 $1,784.71 3/2,0,0,0 1779/A 1962/ASR 7/7/2021
SFR/D 341 6th ST $3,575,000 $2,564.56 3/2,0,0,0 1394/A 1948/ASR 7/7/2021
SFR/D 3521 Laurel AVE $3,550,000 $1,060.65 5/3,1,1,0 3347/A 2014/ASR 7/7/2021
SFR/D 2617 Oak AVE $1,790,000 $1,598.21 3/1,0,0,0 1120/A 1953/ASR 7/8/2021
SFR/D 733 12th ST $4,500,000 $1,026.69 5/6,0,0,0 4383/S 2017/ASR 7/8/2021
SFR/D 1904 Palm AVE $4,600,000 $1,220.81 5/5,0,0,0 3768/A 2018/BLD 7/8/2021
SFR/D 533 5th ST $1,875,000 $2,697.84 2/1,0,0,0 695/A 1931/PUB 7/9/2021
SFR/D 1307 Voorhees AVE $3,750,000 $1,030.79 5/4,0,1,0 3638/A 2019/PUB 7/9/2021
SFR/D 1544 Voorhees AVE $3,995,000 $768.27 6/5,0,1,0 5200/E 2008/ASR 7/9/2021
SFR/D 1704 Highland AVE $4,000,000 $1,209.19 4/4,0,0,0 3308/P 2001/PUB 7/12/2021
SFR/D 461 28th ST $2,400,000 $1,963.99 3/2,0,0,0 1222/A 1954/OTH 7/14/2021
SFR/D 408 29th ST $4,725,000 $1,688.10 4/4,0,0,1 2799/P 2021/PUB 7/14/2021
SFR/D 1130 21st ST $2,900,000 $966.67 5/4,0,1,0 3000/B 2021/SLR 7/15/2021
SFR/D 587 26th ST $3,850,000 $1,108.55 4/3,0,0,0 3473/A 2000/ASR 7/16/2021
SFR/D 877 8th ST $5,250,000 $1,127.09 6/4,1,1,0 4658/A 2006/ASR 7/19/2021
SFR/D 421 32nd PL $1,550,000 $2,129.12 2/1,0,0,0 728/P 1928/PUB 7/20/2021
SFR/D 549 3rd ST $4,799,000 $1,199.75 5/5,0,1,0 4000/SEE 2013/APP 7/21/2021
SFR/D 501 N Poinsettia AVE $5,008,000 $3,608.07 3/1,2,0,0 1388/A 1941/ASR 7/21/2021
TWNHS/A 320 33rd PL $2,480,000 $1,326.20 3/3,0,1,0 1870/A 2007/ASR 7/22/2021
SFR/D 1257 11th ST $1,970,000 $658.20 4/3,0,0,0 2993/A 1960/ASR 7/23/2021
SFR/D 1647 Curtis AVE $3,025,000 $896.30 4/4,0,0,0 3375/T 1996/ASR 7/23/2021
SFR/D 2615 Crest DR $5,900,000 $1,834.58 3/4,0,1,0 3216/A 2016/ASR 7/26/2021
SFR/D 1204 Faymont AVE $1,510,000 $1,628.91 2/1,0,0,0 927/A 1950/ASR 7/26/2021
SFR/D 3201 Maple AVE $3,350,000 $3,172.35 2/1,0,0,0 1056/A 1950/ASR 7/27/2021
SFR/D 706 Anderson ST $2,438,000 $1,283.16 3/2,0,0,0 1900/A 1969/APP 7/27/2021
SFR/D 933 9th ST $5,300,000 $1,337.37 4/2,2,0,0 3963/B 1986/ASR 7/27/2021
SFR/D 1400 Manzanita Lane $3,515,000 $976.93 5/2,2,1,0 3598/B 2021/BLD 7/27/2021
SFR/D 818 8th ST $12,738,290 $1,992.54 5/6,0,0,0 6393/A 2000/PUB 7/28/2021
SFR/D 1751 9th ST $2,600,000 $1,183.43 3/3,0,0,0 2197/A 1986/ASR 7/28/2021
SFR 1705 N Meadows AVE $1,600,000 $1,596.81 3/1,0,0,0 1002/A 1947/ASR 7/29/2021
SFR/D 1610 21st ST $1,650,000 $1,260.50 3/2,0,0,0 1309/A 1952/PUB 7/29/2021
TWNHS/A 1845 11th ST $1,430,000 $1,000.00 2/2,0,0,0 1430/B 2021/ASR 7/29/2021
SFR/D 1618 6th ST $3,279,415 $809.73 5/5,0,0,0 4050/S 1998/ASR 7/29/2021
SFR/D 1622 5th ST $3,525,000 $839.29 4/3,0,1,0 4200/A 1991/ASR 7/29/2021
DPLX/A 219 27th ST $4,000,000 $1,388.89 5/3,0,1,0 2880/A 1972/ASR 7/30/2021
SFR/D 935 Boundary PL $2,080,000 $1,047.33 4/3,0,0,0 1986/E 1956/PUB 7/30/2021